
Fitting of Standard Curve of Competitive Inhibition ELISA
As we know, for antigens with multiple epitopes, double sandwich ELISA (Double Sandwich ELISA) can be applied to the quantitative detection of target antigens or antibodies. While for small molecule or hapten, as lacking of more than two binding sites for double sandwich detection, double sandwich method is not suitable. In this case, competitive inhibition method can be applied to detect target molecules. Competitive inhibition ELISA also can be called blocking ELISA, its main principle is the competive binding of the antigens within the samples and the certain amount of labeled-antigens with antibody on the solid-phase. The more amount of antigen in samples, the less labeled antigen be bound on solid phase enzyme, so the final color will be lighter, i.e., The amount of bound HRP conjugate is reverse proportional to the concentration of target molecules in the samples. After addition of the substrate solution, the intensity of color developed is reverse proportional to the concentration of target molecules in the samples. small molecule such as hormone generally use this method.
For laboratory personnels who are used to double sandwich ELISA, they often encounter to the problems that how to deal with the data of competitive inhibition ELISA. Last time, we have discussed the plotting and fitting of classic double-sandwich ELISA standard curve(Fitting of Standard Curve of Double Sandwich ELISA). Now we will introduce the fitting step of standard curve in competition inhibition ELISA by using EXCEL software.
We choose the standard absorbance value of Cloud. Clone's CEA924Ge, ELISA Kit for Cyanocobalamin (CNCbl) as a reference, as shown in Figure 1, the highest 10000 pg/mL concentration of the standard (F1 in Figure 1), diluted to 123.5 pg/mL concentration (B1), negative control (A1). We can see that for the competitive inhibition ELISA, the blank well has the highest OD.
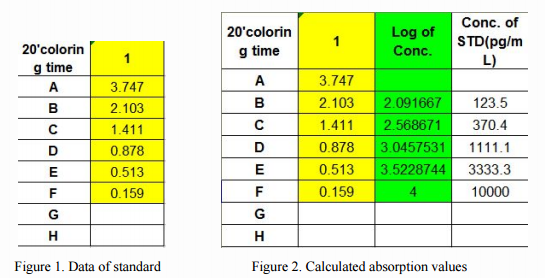
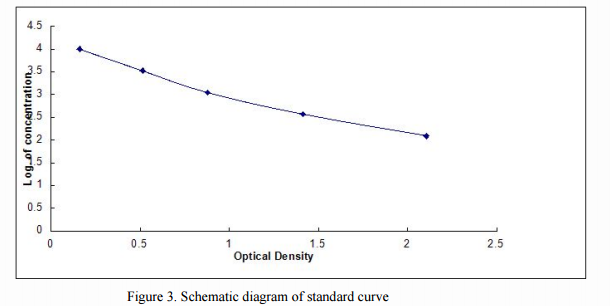
Different from the OD of double-sandwich ELISA, it is no need to minus the absorbance of negative control well in competition inhibition ELISA. Then, we plot the O.D. value of the standard (X-axis) against the log of concentration of the standard (Y-axis), as a XY scatter plot (highlighted in green parts shown in Fig. 2), to get a 5-point curve. As shown in Figure 3, the X-axis is the Optical Density, and the Y-axis is the Log. of Concentration.
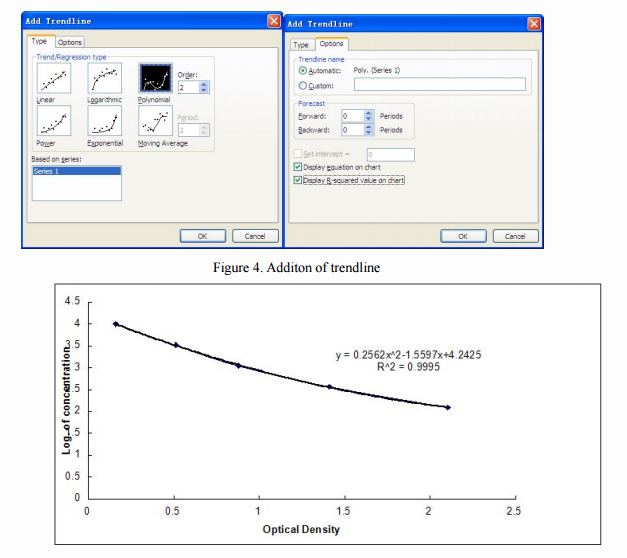
Then, optionally, choose any point in the curve, right click, select "Add Trendline (R)", a dialog box will pop up on the chart. users can select the "polynomial (P in the" Type "option ) "and" order (P) "is set to the second order. Finally, in the "Options" check "Show formula (E)" and "Display R-squared value (R)" (Figure 4), click OK, we can obtain the corresponding value of the standard formula and R 2 value (as shown in Figure 5).
In the fitting of the standard curve, how can we judge whether the standard curve is good or not. In general, a good standard curve should have the following three points:
1) The higher of concentration of standard, the lower of OD we will get, i.e. the amount of bound HRP conjugate is reverse proportional to the concentration of traget molecules in the sample.
2) R2 value is greater than 0.95, it’s better to be 1 as close as possible;
3) The OD of blank well should be higher than 0.8.
Finally, we concluded the standard curve process and analyze common problems and corresponding solutions are summarized as follows:
| Problem | Possible Source | Correction Action |
| Poor background | Contaminated negative control well | Change and use new pipette tips, containers and sealers |
| Poor R 2 | Improper standard curve preparation | Ensure accurate operation of the dilution |
| Improper standard curve dilution | Ensure accurate dilution of the dilution | |
| Inaccurate Pipetting | Check and Calibrate pipettes | |
| Reused pipette tips, containers and sealers | Change and use new pipette tips, containers and sealers | |
| Low O.D Values | Improper standard curve preparation | Ensure accurate operation of the dilution |
| Improper standard curve dilution | Ensure accurate dilution of the dilution | |
| Inaccurate Pipetting | Check and Calibrate pipettes | |
| Incorrect incubation times | Ensure sufficient incubation times | |
| Incorrect incubation temperature | Reagents balanced to room temperature | |
| Conjugate or substrate reagent failure | Mix conjugate &substrate,color should develop immediately | |
| No stop solution added | Follow the assay protocol in the kit manual |