
Fitting of standard curve of double sandwich ELISA
Since the 1970s, ELISA, as a simple and rapid method for the quantitative determination trace protein, has been widely used in many fields of biology and medicine.
Enzyme linked immunosorbent assay (ELISA, Enzyme-Linked Immunosorbnent Assay) is a new immunoassay technique based on the solid-phased antigen or antibody and enzyme-labeled antigen or antibody binding. It can be divided into those four categories: direct ELISA, indirect ELISA, sandwich ELISA and competitive inhibition ELISA. And wherein, the most widely used method for quantitative detection of the antigen or antibody is double sandwich ELISA, which is obtained by a known antigen or antibody adsorbed on a solid phase carrier surface, was measured by an antigen-antibody reaction with the package, followed by addition of enzyme substrate, the catalytic substrate into a colored product, and finally the quantitative analysis according to the depth of coloration.
A quantitative detection means a high sensitivity, double sandwich ELISA absorbance values required by substituting the sample into the corresponding standard curve in order to determine the final concentration. Therefore, the standard curve and fitting is essential for the experiment’s success. For starters, it is generally hard to choose one kind of suitable ELISA data analysis software from EXCEL, SPSS, CurveExpert, Origin, etc. Because EXCEL is one of the most popular softwares daily, then we will take this as an example to explain how to fit the curve for a typical double sandwich method.
We choose a standard absorbance value of Cloud. Clone's SEA079Ra, ELISA Kit for Interleukin 6 (IL6) as a reference, as shown in Figure 1, the highest 100 pg/mL concentration of the standard (H1 in Figure 1), diluted into 1.56 pg/mL concentration (B1), negative control (A1).
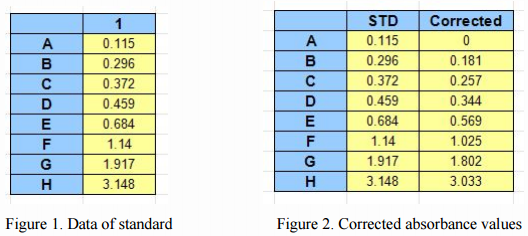
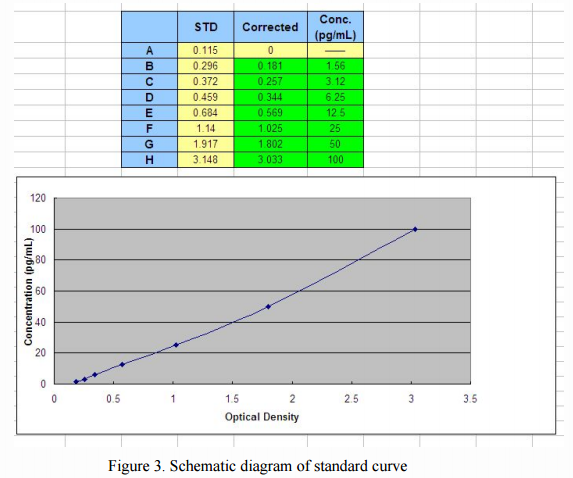
First, the absorbance values of each well minus the absorbance of the negative control (background), the corrected absorbance values obtained (shown in Figure 2), then, we plot the O.D. value of the standard (X-axis) against the known concentration of the standard (Y-axis), as a XY scatter plot (highlighted in green parts shown in Fig. 3), to get a curve. (Such curve is generally a straight line, the approximate straight line or S-type (Figure 3).
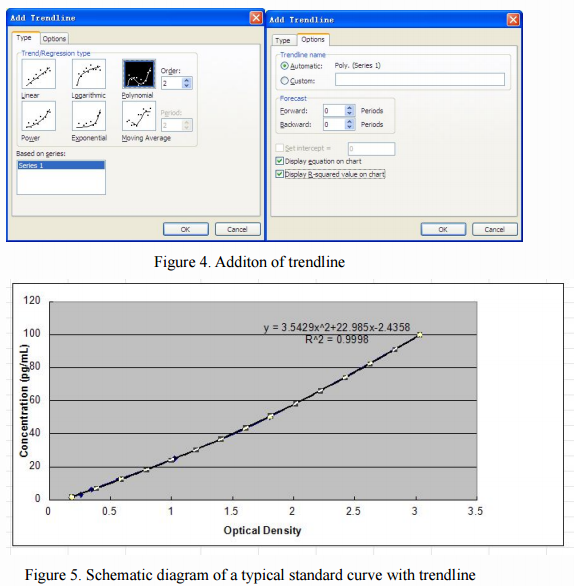
Then, optionally, choose any point in the curve, right click to open, select "Add Trendline (R)", a dialog box will pop up on the chart. When the standard curve is linear or nearly linear, you can select the "linear (L)" in the "Type" option, and when standard curve is S-type, you can select the "polynomial (P in the" Type "option ) "and" order (P) "is set to the second order. Finally, in the "Options" check "Show formula (E)" and "Display R-squared value (R)" (Figure 4), click OK, we can obtain the corresponding value of the standard formula and R2 value (as shown in Figure 5).
In the fitting of the standard curve, how can we judge whether the standard curve is good or not? In general, a good standard curve should have the following three points:
1) Negative control wells OD value should be less than 0.25;
2) R 2 value is greater than 0.95, it’s better to be 1 as close as possible;
3) The maximum absorbance value should be higher than 0.8.
Finally, we concluded the standard curve process and analyze common problems and corresponding solutions are summarized as follows:
| Problem | Possible Source | Correction Action |
| Poor background | Contaminated negative control well | Change and use new pipette tips, containers and sealers |
| Poor R2 | Improper standard curve preparation | Ensure accurate operation of the dilution |
| Improper standard curve dilution | Ensure accurate dilution of the dilution | |
| Inaccurate Pipetting | Check and Calibrate pipettes | |
| Reused pipette tips, containers and sealers | pipette tips, containers and sealers Change and use new pipette tips, containers and sealers | |
| Low O.D Values | Improper standard curve preparation | Ensure accurate operation of the dilution |
| Improper standard curve dilution | Ensure accurate dilution of the dilution | |
| Inaccurate Pipetting | Check and Calibrate pipettes | |
| Incorrect incubation times | Ensure sufficient incubation times | |
| Incorrect incubation temperature | Reagents balanced to room temperature | |
| Conjugate or substrate reagent failure | Mix conjugate &substrate,color should develop immediately | |
| No stop solution added | Follow the assay protocol in the kit manual |