
Packages (Simulation)
Image (II)
-
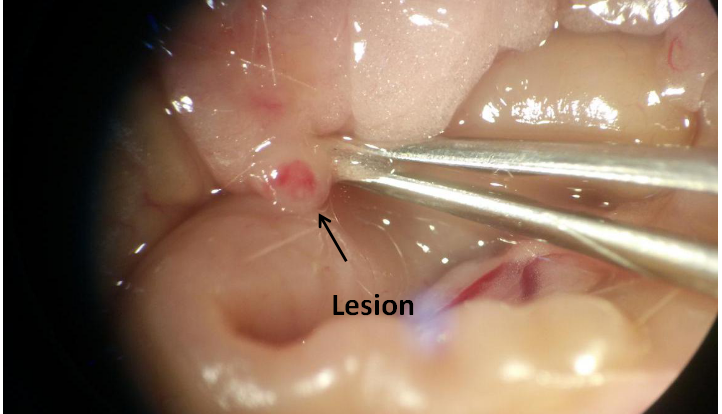 Fig. Lesions in operation group mice on 7th days after modeling
-
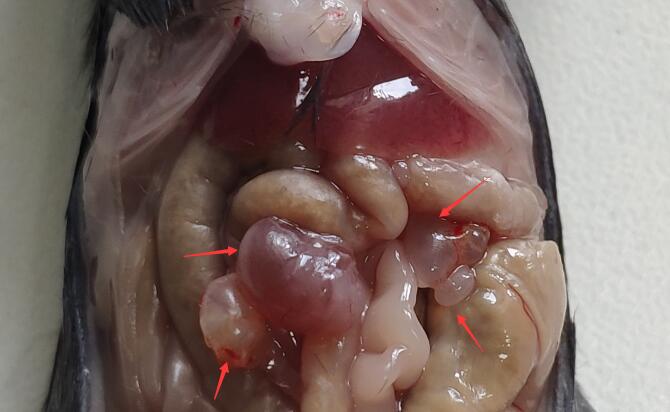 Fig. Lesions in operation group mice on 28d after modeling
Quality Guarantee

Certificate


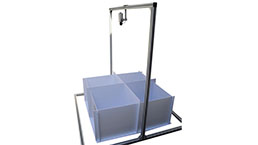
Mouse Model for Endometriosis (EM)
Endometriosis uterina
- Product No.DSI543Mu01
- Organism SpeciesMus musculus (Mouse) Same name, Different species.
- Prototype SpeciesHuman
- SourceTransplantation of allograft uterine endometrium induced
- Model Animal StrainsBalb/c Mice, healthy, female, 6-8W, body weight 20g-22g
- Modeling GroupingRandomly divided into six group: Control group, Model group, Positive drug group and Test drug group (three doses)
- Modeling Period2W
- Modeling Method1. Randomly select one mouse as a donation, killed by dislocation of cervical vertebra, fixed on the operating table, abdominal alcohol disinfection, along the midline ripped abdomen. Find the Y-shaped uterus, carefully pull respectively the left and right uterine, careful separation of bilateral uterine membrane.
2. Breaking away from uterine horns and ovary, the Y-shaped uterus are cut at the left and right uterine bifurcation, into a bowl with physiological saline aseptic curved plate, repeated rinsing the uterine, and separation remaining adhered the mesometrium. Placed two uterine horns in two sterile curved plate, and cut into pieces of 1 * 1mm, and suspended in normal saline.
3.1/2 uterus from one donated mouse is planted in one receptor mouse,and the tissue fragments are put in the saline suspension.
4.Randomly select one mouse as recipients, the left lower quadrant of the mouse umbilical cord was taken as the point of needle insertion., the uterine tissue fragments are injected into recipients through intraperitoneal injection. - ApplicationsDisease Model
- Downloadn/a
- UOM Each case
- FOB
US$ 240
For more details, please contact local distributors!
Model Evaluation
1. Observation: seventh days after modeling, the mice are sacrificed to observe the lesion, and the survived lesions show a variety of forms, such as red, blue, purple, white, orange and other vesicles, and some of the surrounding adhesion.
Pathological Results
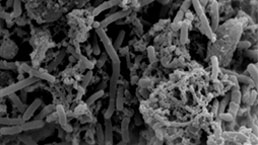
Histological changes of ectopic endometrium after modeling
The glands and stroma cells are abundant, and the structure of the gland is normal and the blood vessels were abundant.
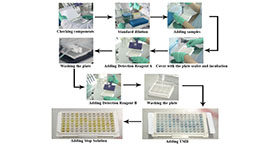
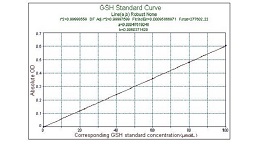
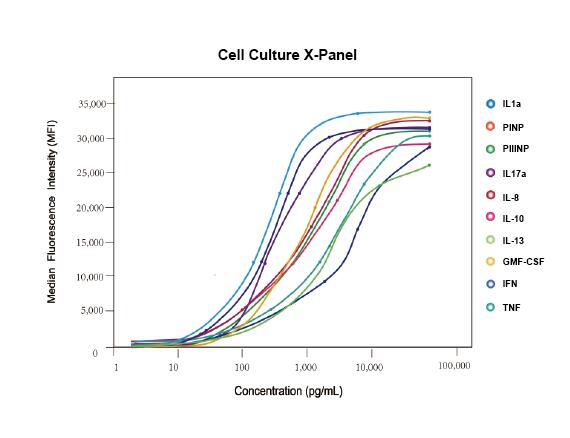
Cytokines Level
Statistical Analysis
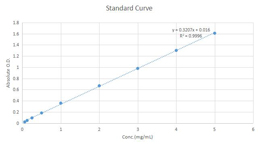
SPSS software is used for statistical analysis, measurement data to mean ± standard deviation (x ±s), using t test and single factor analysis of variance for group comparison, P<0.05 indicates there was a significant difference, P<0.01 indicates there are very significant differences.
GIVEAWAYS
INCREMENT SERVICES
-
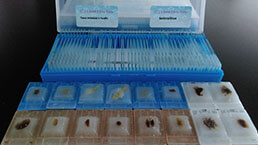 Tissue/Sections Customized Service
-
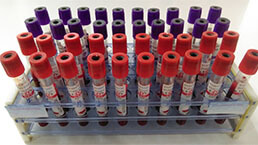 Serums Customized Service
-
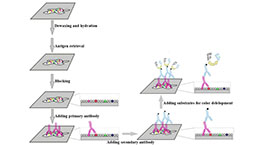 Immunohistochemistry (IHC) Experiment Service
-
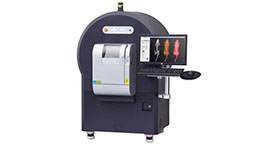
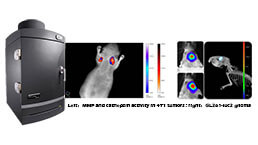 Small Animal In Vivo Imaging Experiment Service
-
 Small Animal Micro CT Imaging Experiment Service
-
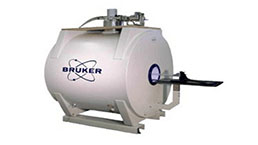 Small Animal MRI Imaging Experiment Service
-
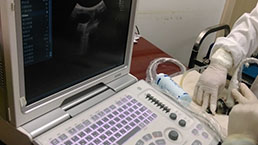 Small Animal Ultrasound Imaging Experiment Service
-
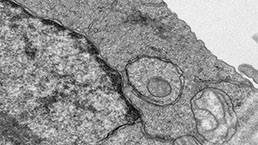 Transmission Electron Microscopy (TEM) Experiment Service
-
 Scanning Electron Microscope (SEM) Experiment Service
-
 Learning and Memory Behavioral Experiment Service
-
 Anxiety and Depression Behavioral Experiment Service
-
 Drug Addiction Behavioral Experiment Service
-
 Pain Behavioral Experiment Service
-
 Neuropsychiatric Disorder Behavioral Experiment Service
-
 Fatigue Behavioral Experiment Service
-
 Nitric Oxide Assay Kit (A012)
-
 Nitric Oxide Assay Kit (A013-2)
-
 Total Anti-Oxidative Capability Assay Kit(A015-2)
-
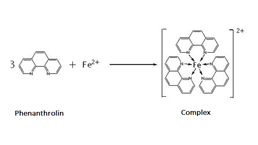 Total Anti-Oxidative Capability Assay Kit (A015-1)
-
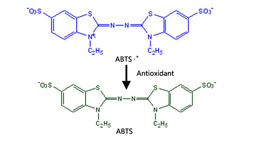
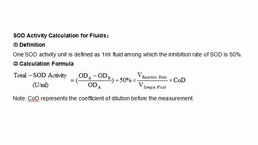 Superoxide Dismutase Assay Kit
-
 Fructose Assay Kit (A085)
-
 Citric Acid Assay Kit (A128 )
-
 Catalase Assay Kit
-
 Malondialdehyde Assay Kit
-
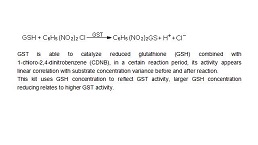 Glutathione S-Transferase Assay Kit
-
 Microscale Reduced Glutathione assay kit
-
 Glutathione Reductase Activity Coefficient Assay Kit
-
 Angiotensin Converting Enzyme Kit
-
 Glutathione Peroxidase (GSH-PX) Assay Kit
-
 Cloud-Clone Multiplex assay kits
| Catalog No. | Related products for research use of Mus musculus (Mouse) Organism species | Applications (RESEARCH USE ONLY!) |
| DSI543Mu01 | Mouse Model for Endometriosis (EM) | Disease Model |